skip to main content

How many U.S. college students use APA Style?

APA Style leaf logo Cite This Webpage in APA Style
Lee, C. (2024, May 29). How many U. S. College students use APA Style? APA Style. https://apastyle.apa.org/blog/college-students

How many U.S. college students use APA Style?

Without a doubt, APA Style is one of the most widely used writing styles in the world. Millions of people engage with the APA Style website each year as well as take advantage of other APA Style resources such as the seventh edition Publication Manual, which was published in 2020.

Many of these APA Style users are college students in the social sciences, which includes fields such as psychology, nursing, education, social work, library science, and public administration. But APA Style is a writing style option for many more students in other fields that may surprise you, including business, engineering, kinesiology, and law enforcement.

By the time students get to college and are taking classes for their majors, instructors often expect them to already know APA Style. This means students need to learn APA Style earlier, such as in high school or the beginning of college in first-year writing classes. Students facing the task of learning APA Style are often skeptical about its value—after all, learning (and teaching) any writing style takes time and effort. People want to be sure that APA Style will be a wise investment.

To understand more about how widely used APA Style is in college—and thus how useful it might be to know, no matter what you study or plan to study—we on the APA Style team set out to quantify how many U.S. college students use or could use APA Style. We present the results of that work in the form of an APA Style research paper.

Method

To answer the question of how many U.S. college students use APA Style, the APA Style team gathered data about

  • how many college degrees were awarded in the United States by field of study and
  • what writing style is used in each field of study.

To determine the number of college degrees, we used data from the U.S. Department of Education’s National Center for Education Statistics (NCES)opens in new window, specifically the 2023 annual report, the Digest of Education Statisticsopens in new window. This report contains the most recent data available and provides information on degrees from the 2021–2022 academic year. We considered degrees at four levels (associateopens in new window, bacheloropens in new window, masteropens in new window, and doctoralopens in new window) as well as all degrees combined.

For the fields of study, we used NCES’s aggregated degree classification taxonomy, which has 10 fields:

  • humanities
  • psychology
  • social sciences and history
  • natural sciences and mathematics
  • computer sciences
  • engineering
  • education
  • business
  • health professions and related programs
  • other fields

The “other fields” category includes communications and journalism; homeland security, law enforcement, and firefighting; parks, recreation, leisure, fitness, and kinesiology; agriculture and natural resources; public administration; legal studies; and library science.

Of note, NCES also provides data using a more detailed taxonomy with 31 fields of study. However, results did not differ based on whether we used 10 or 31 categories, so we elected to use the simpler system in this analysis.

To assign a writing style to each field of study, we consulted

  • the instructions to authors for prominent professional journals in the fields, which typically designate a writing style or list acceptable styles, and
  • library guides for students in those fields, which advise students at that school what writing style(s) to use for that major.

The values for the writing style variable were as follows:

  • APA Style required
  • APA Style option
  • other writing style

“Other” writing styles included Chicago, Modern Language Association (MLA), Associated Press (AP), Legal Bluebook, American Mathematical Society (AMA), American Chemical Society (ACS), and Institute for Electrical and Electronics Engineers (IEEE) styles. Then we calculated frequencies and percentages for the data, which are reported next.

Results

Table 1 displays the writing style we assigned to each field of study.

Table 2 displays the number of degrees awarded in the United States for the 10 fields of study in the 2021–2022 academic year at the associate’s, bachelor’s, master’s, and doctoral levels as well as all degrees combined.

Table 1

Writing Styles Associated With U.S. College Degrees

Field of study

APA Style required

APA Style option

Other style

Humanities


X

Psychology

X


Social sciences and history


X


Natural sciences and mathematics


X

Computer sciences


X

Engineering


X


Education

X


Business


X


Health professions and related programs

X


Other fields


X


Table 2

U.S. College Degrees Awarded in the 2021–2022 Academic Year

Field of study

All degrees

Associate’s degrees

Bachelor’s degrees

Master’s degrees

Doctoral degrees

Humanities

766,022 (18.6)

445,297 (44.2)

252,324 (12.5)

59,804 (6.8)

8,597 (4.2)

Psychology

189,260 (4.6)

19,305 (1.9)

129,609 (6.4)

33,661 (3.8)

6,685 (3.3)

Social sciences and history

203,050 (4.9)

26,847 (2.7)

151,109 (7.5)

20,614 (2.3)

4,480 (2.2)

Natural sciences and mathematics

264,887 (6.4)

22,329 (2.2)

185,975 (9.2)

39,294 (4.5)

17,289 (8.5)

Computer sciences

197,389 (4.8)

34,758 (3.4)

108,503 (5.4)

51,338 (5.8)

2,790 (1.4)

Engineering

259,176 (6.3)

56,172 (5.6)

141,422 (7.0)

49,339 (5.6)

12,243 (6.0)

Education

274,454 (6.7)

18,498 (1.8)

89,410 (4.4)

151,707 (17.2)

14,839 (7.3)

Business

698,724 (17.0)

113,070 (11.2)

375,418 (18.6)

205,751 (23.4)

4,485 (2.2)

Health professions and related programs

675,963 (16.5)

177,413 (17.6)

263,765 (13.1)

147,035 (16.7)

87,750 (43.0)

Other fields

578,528 (14.1)

94,596 (9.4)

317,500 (15.8)

121,706 (13.8)

44,726 (21.9)

Total degrees

4,107,453

1,008,285

2,015,035

880,249

203,884

Note. The table shows frequencies with percentages in parentheses. Data on the number of associate’s, bachelor’s, master’s, and doctoral degrees are from the National Center for Education Statistics (2023a, 2023b, 2023c, 2023d, respectively).

These data show that different fields of study are more popular at different degree levels, with fields that require or allow APA Style as an option becoming more popular at higher degree levels.

  • For associate’s degrees, the humanities were the most popular field of study (44.2%). The humanities category includes fields such as English language and literature, foreign languages, visual and performing arts, philosophy and religion, and multi/interdisciplinary studies. Humanities programs typically do not use APA Style.
  • For bachelor’s and master’s degrees, business was the most popular field of study (18.6% and 23.4%, respectively). Business programs typically allow APA Style as an option.
  • For doctoral degrees, health professions and related programs were the most popular field of study (43.0%). Health profession programs such as nursing typically require APA Style.

Across degree levels, approximately 10% to 20% of degrees were awarded in the “other fields” category. Most of these fields allow APA Style as an option (e.g., homeland security, public administration) or require it (e.g., library science). Some use other writing styles (e.g., legal studies, which uses the Legal Bluebook, and journalism, which uses AP style).

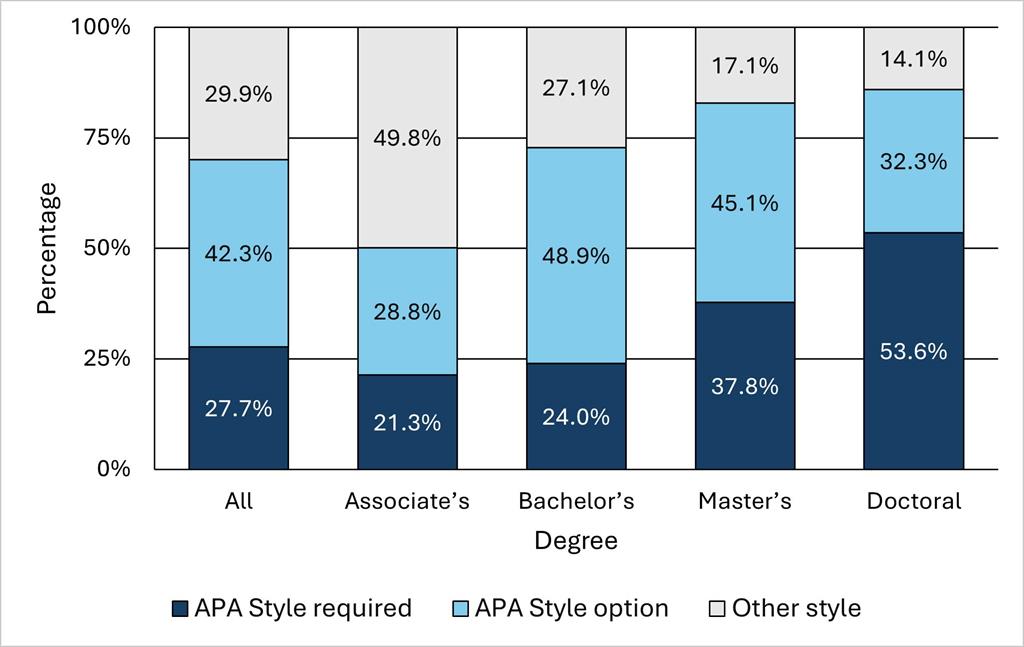
Figure 1 shows the college degrees grouped by the writing style most used in the degree field.

Figure 1

Writing Style Used for College Degrees by Degree Level

Figure showing the writing style used for college degrees by degree level

The big-picture takeaway from Figure 1 is that 70% of all college degrees awarded in 2021–2022 in the United States were in fields that require APA Style (27.7%) or allow APA Style as an option (42.3%). When considering specific degree levels, APA Style becomes more dominant as the level of the degree increases.

  • For associate’s degrees, 50.1% were in fields that require APA Style (21.3%) or allow APA Style as an option (28.8%).
  • For bachelor’s degrees, 72.9% were in fields that require APA Style (24.0%) or allow APA Style as an option (48.9%).
  • For master’s degrees, 82.9% were in fields that require APA Style (37.8%) or allow APA Style as an option (45.1%).
  • For doctoral degrees, 85.9% were in fields that require APA Style (53.6%) or allow APA Style as an option (32.3%).

When examining only the fields that require APA Style, the pattern is similar: As the degree level increases, it becomes more likely that APA Style will be required, because fields that use APA Style are more popular at higher degree levels. Most striking is that 53.6% of doctoral degrees are awarded in fields that require APA Style, which reflects the high number of doctoral degrees awarded in health professions and related fields.

Discussion

APA Style is the dominant writing style used in college in the United States, particularly at the bachelor’s degree level and higher. Because the goal of any writing is clear communication, and because communication is enhanced when writers and readers adhere to a common system, it is perhaps not surprising that the higher education academic community has converged on a dominant writing style, with 70% of all college degrees potentially requiring APA Style or allowing it as an option for writing academic assignments.

The widespread use of APA Style in college makes a compelling argument for students to learn APA Style. In particular, high school students who plan to go to college may benefit from learning APA Style; seven out of 10 of them will likely choose a major in which they can use APA Style. This cohort of students typically already knows MLA style; if that describes you or students with whom you work, check out the blog post on why to learn APA Style if you already know MLA style as well as the free APA Style and MLA Style Reference Comparison Guide (PDF, 104KB)opens in new window.

Strengths, limitations, and future directions

Strengths of this work include that it relied on official data from the U.S. government, capturing more than 4 million degrees awarded in the 2021–2022 school year. Another strength is that it used an existing taxonomy for degree classification. Degrees are awarded in hundreds of different majors, and this version of the taxonomy has been in use for more than 40 years, meaning it is familiar to many when describing the landscape of higher education.

However, this work has some limitations. First, it is important to note that just because APA Style is allowed as an option in many fields does not mean that everyone in those fields will choose APA Style. For example, it is possible that students will choose another writing style because they are more familiar with it, it is better suited to their work, or the instructor requires it. Second, the NCES data do not capture granular detail about the number of degrees awarded within fields. For example, the health professions and related programs categoryopens in new window includes many domains that require APA Style, such as nursing, speech-language pathology, physical therapy, marriage and family therapy, and clinical nutrition. However, others do not—medicine uses AMA style, and public health uses APA Style in some cases and AMA style in others. Thus, the actual usage of APA Style at the college level may be lower or different than is suggested here.

On the other hand, usage of APA Style may be higher in some cases. For example, some universities, such as the University of Phoenix and Walden University, have chosen to adopt APA Style at the university level. At schools that adopt APA Style at the university level, even students in fields that do not typically use APA Style or in which students typically have a choice of writing style are using APA Style.

Furthermore, although college is an important context in which to examine the use of APA Style, other contexts matter too. This work did not address how many people use APA Style in contexts such as research publication in academic journals, business and professional life, college classes that do not count toward a degree, and high school. Although we considered what writing style is required for the professional academic journals of that field when assigning a writing style to a field, fields vary in their emphasis on writing and in how strictly they expect authors to adhere to a writing style when publishing. We know APA Style is the expectation for psychology and nursing journals, but the actual degree to which professional journals in other fields actually use APA Style remains to be investigated.

An additional consideration is that we focused on the use of APA Style in the United States. Although APA Style is most established in the United States, it is used around the world, with notable levels of adoption in Canada, Australia, and New Zealand. Future work could address the prevalence of APA Style in those as well as other countries to identify patterns.

A related consideration is how APA Style is used in languages other than English. The Publication Manual (7th ed.) is currently available in translation in four other languages: Spanish, Portuguese, Greek, and Japanese, with plans for more languages in the future. Although much of APA Style is relevant no matter what language you’re writing in, some aspects of APA Style, such as guidelines for writing about personal characteristics using bias-free and inclusive language, cannot be strictly translated but rather require adaptation and consideration of the cultural context. It would be interesting to examine how APA Style is or could be used in those cases.

Conclusion

There is no disputing the prevalence of APA Style in higher education. Seven out of 10 U.S. college students choose majors in which they could use APA Style, and APA Style becomes increasingly the expectation at higher degree levels. However, anyone who consumes scientific literature would be well-served to understand the basics of APA Style, such as how to use APA Style to read and understand abstracts (PDF, 437KB)opens in new window or how journal articles are put together (PDF, 227KB)opens in new window. Basic literacy in APA Style allows anyone to become a better consumer of scientific information.

If this work has convinced you or someone you care about to learn APA Style, the APA Style team is here to help. All people new to APA Style should check out the APA Style for beginners landing page. If you would like to share ideas for teaching APA Style or for improving our resources, please contact the APA Style team.

The mission of the American Psychological Association is to use psychology to improve people’s lives; in the APA Style department, we hope to do that by designing a style that is meaningful, meets the needs of users, and makes sense to learn and apply. We also appreciate any insights you want to share in the comments about the use of APA Style at your school.


References

National Center for Education Statistics. (2023a). Table 321.10. Associate’s degrees conferred by postsecondary institutions, by sex of student and field of study: Academic years 2011-12 through 2021-22. Digest of Education Statistics. https://nces.ed.gov/programs/digest/d23/tables/dt23_321.10.aspopens in new window

National Center for Education Statistics. (2023b). Table 322.10. Bachelor’s degrees conferred by postsecondary institutions, by field of study: Selected academic years, 1970-71 through 2021-22. Digest of Education Statistics. https://nces.ed.gov/programs/digest/d23/tables/dt23_322.10.aspopens in new window

National Center for Education Statistics. (2023c). Table 323.10. Master’s degrees conferred by postsecondary institutions, by field of study: Selected academic years, 1970-71 through 2021-22. Digest of Education Statistics. https://nces.ed.gov/programs/digest/d23/tables/dt23_323.10.aspopens in new window

National Center for Education Statistics. (2023d). Table 324.10. Doctor’s degrees conferred by postsecondary institutions, by field of study: Selected academic years, 1970-71 through 2021-22. Digest of Education Statistics.  https://nces.ed.gov/programs/digest/d23/tables/dt23_324.10.aspopens in new window

Comments are disabled due to your privacy settings. To re-enable, please adjust your cookie preferences.