

You have run your experiment and crunched the data, and now you are ready to report your carefully calculated statistics in a table or figure. Among the statistics to be reported are the p values, indicating the significance of your results. How should this be done? The good news is that you have two options, and you need to choose only one.
Lazer, S. (2026, February 2). Methods of reporting significance in tables and figures: Pick one! APA Style. https://apastyle.apa.org/blog/methods-tables-figures

The options
Option 1
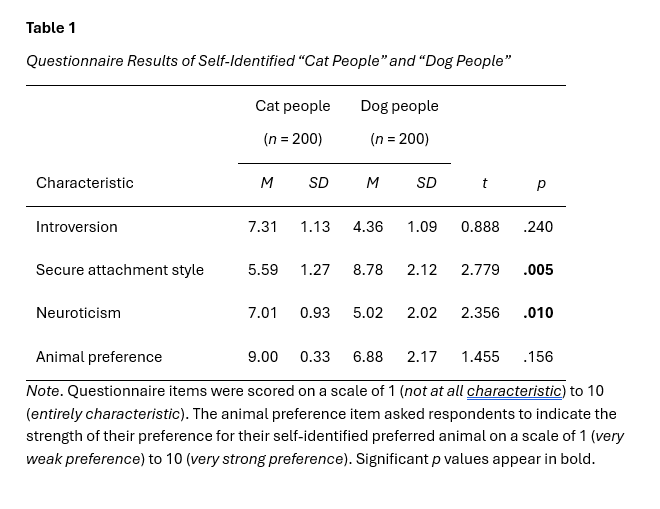
As noted in Section 7.14 of the Publication Manual of the American Psychological Association (7th ed.), “To report the results of significance testing, it is best to provide the exact probabilities to two or three decimal places” (American Psychological Association [APA], 2020, p. 204). Reporting exact p values in a column or row of a table or within a figure is thus Option 1.
Option 2
Sometimes reporting exact probabilities is not ideal, perhaps because the table is already large or the figure is visually complicated. In such cases, the Publication Manual notes that “an alternative to reporting exact p values . . . is to use the ‘p <’ notation” (APA, 2020, p. 204). The p < notation involves using asterisks or daggers in the table or figure to identify statistics with significant p values that fall within certain ranges—traditionally, p < .05, p < .01, and/or p < .001—and then defining what each asterisk or dagger pattern means in the probability note that appears beneath the general and specific notes of the table or figure. This method is used only in tables and figures (i.e., do not use asterisks or daggers in the text to identify your significance values). This approach constitutes Option 2.
But how do I highlight significant values?
Let’s say, though, that you want to draw attention to the significant p values you are reporting in your table or figure. Your first thought may be to use both Options 1 and 2: That should make those significant p values pop! But if you look at what is literally being done—Option 1 is reporting an exact p value and Option 2 is reporting a p value approximation—the logic of using both is questionable. Also, recall that the Publication Manual characterized Option 2 as an “alternative” (APA, 2020, p. 204) to Option 1. Thus, you should be using one or the other method, but not both in the same table or figure. (Note that you could use Option 1 in one table but then deploy Option 2 in another, provided the two tables are reporting different types of information and are not intended to be directly compared.)
How, then, should those significant values be highlighted? If you are worried that the p values will not speak for themselves (although consider that they might—maybe ask a colleague or beta reader for a second opinion), try putting the ones you want to highlight in bold, then explain in the general note what the bold signifies. Please note that bold is a formatting option in situations where you want to emphasize significant reported results: Using bold is not a requirement to highlight significant p values themselves or results with significant p values.
Here is an entirely fictional example of a table implementing both Option 1 and bold:
The same “try highlighting the p values in bold” strategy works for Option 2 as well, as shown in the following entirely fictional example implementing both Option 2 and bold.
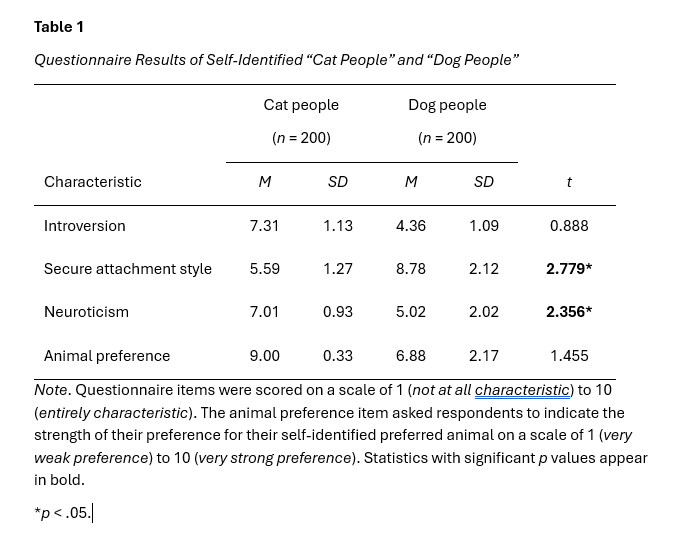
Bold can be used to denote other meanings in tables and figures, so an explanation for what the bold signifies should always appear in the general note, as outlined in Section 7.14 and again in Section 7.20’s table checklist and touched on in Section 7.28 and again in Section 7.35’s figure checklist (APA, 2020). Finally, to reiterate, Option 1 can be used with or without bold, Option 2 can be used with or without bold, but Options 1 and 2 should not be used in the same table or figure together whether with or without bold.
Any other questions about p values? Please share them in the comments.
Reference
American Psychological Association. (2020). Publication manual of the American Psychological Association (7th ed.). https://doi.org/10.1037/0000165-000

Comments are disabled due to your privacy settings. To re-enable, please adjust your cookie preferences.